


Instant nodal data and insights at your fingertips
Bankable nodal basis forecasts for all operational and committed generators.

Bankable nodal basis insights
Bankable nodal basis insights
Security constrained economic dispatch (SCED) power flow modelling rather than top-down regression for more thoughtful and comprehensive analysis.


What is included in our Nodal Explorer?
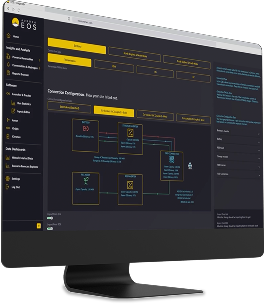
Nodal Explorer and Maps tool
Explore nodes, overlay constraints, track capacity buildout

Key Use Cases
How are developers, investors, and asset managers using the Nodal Explorer? Leverage interconnection queue intelligence, bankable nodal forecasts, and transmission analytics to optimize site selection and investment decisions.


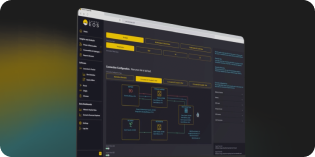
Product Preview


Select your market and drill down to the nodes
Overlay the Transmission Network alongside our forecast
Visualize capacity coming online with the Interconnection Queue overlay
Track hundreds of announced transmission projects from major grid operators with the Network Upgrades Layer
Identify bottleneck transmission lines where capacity constraints drive up system costs with the Network Constraints Layer
Identify the projects most likely to move forward with the Modelled Capacity Layer
Analyze specific nodes at a granular level in the Nodal Chart Explorer
Expert support available on demand

Onboarding sessions
Receive onboarding sessions tailored to your use case
Thematic insights
Benefit from thematic deep dives and new feature trainings

Expert valuation
Review your valuations with our experts

Community events
Join online and offline community events

Smarter energy solutions start here
Gain unparalleled expertise in renewable energy analytics. Our team delivers data and insights designed to navigate complexities, manage risks, and unlock opportunities tailored to your sector.


