
Spanish Grid Curtailment Forecast

Quantify Your Financial Risk With Nodal-Level Precision

NEW GRANULAR DETAIL for the Spanish power markets.

Download sample report

Nodal-level analysis reveals hidden risks conventional models miss. Our forecast:

✓ Identifies specific nodes experiencing high curtailment
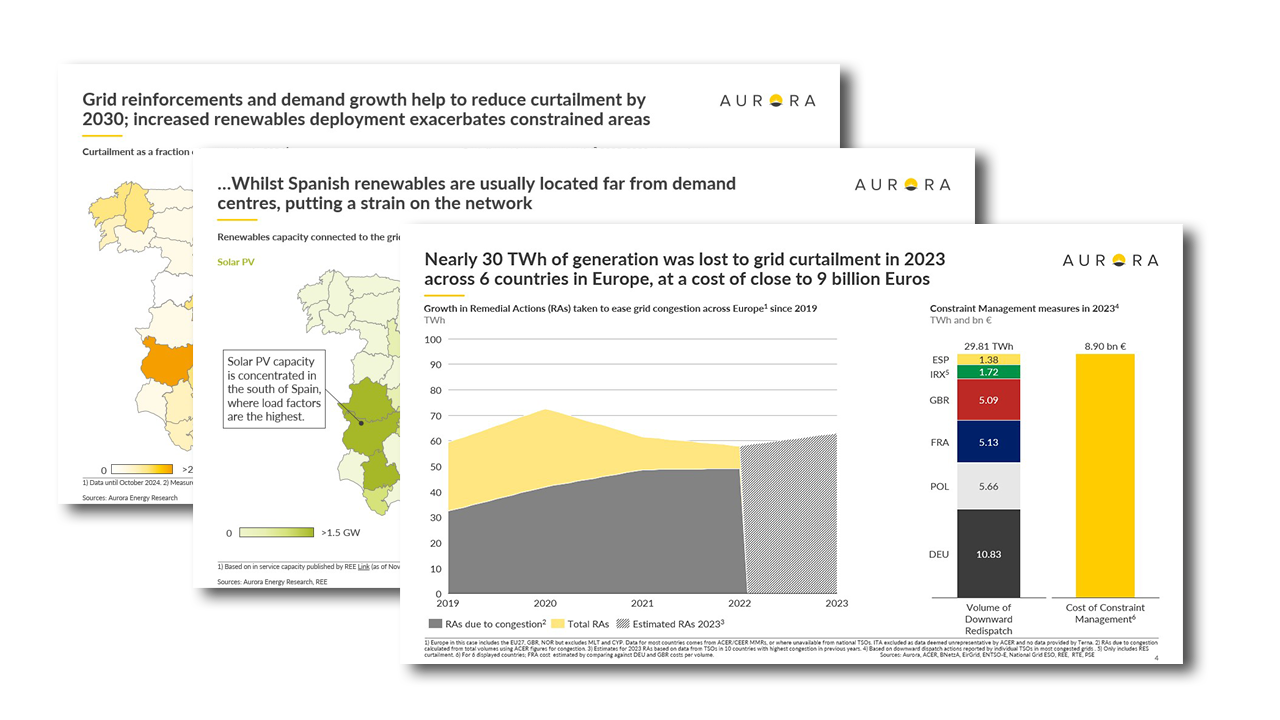
✓ Maps the impact across all Spanish provinces
✓ Forecasts changes through 2030 as demand centres shift
Opportunities near planned grid reinforcements

Download sample report

Download our sample report

Preview our preliminary Grid Curtailment Forecast insights:

  • Historical trends
  • Modelling approach
  • Input assumptions
  • Market outlook
  • Regional deep-dives

Complete the form below to download a more comprehensive overview of our Grid Curtailment Forecast.

What is included in our Grid Curtailment Forecast?

Quarterly data and market reports forecasting nodal outcomes to 2060.

Bankable nodal basis forecasts

Around-the-Clock pricing basis, Top-Bottom 2/4 hour spread basis, and generation-weighted average solar and wind basis on yearly and monthly granularity for all generator nodes

Key insights of modelling methodology

In-depth explanation of the various assumptions and modelling methodologies driving our representation of generation, demand, and network changes

Explanatory analysis of forecasted LMP in key areas

Heat maps, charts, and commentary to explain the drivers of our nodal basis forecast in regional deep-drives

Data in Excel

Easily downloadable Excel workbook detailing historical and forecasted results including capacity interconnection and yearly / monthly basis for all generator nodes

EOS Nodal Map

Historical and forecasted nodal prices available in EOS mapping tool and via Aurora API

Analyst support

Access to market experts to address any questions you may have on the insights presented in the reports
Submit interest

Highlighting key regional trends:

  • Overview of the current landscape of congestion and nodal basis
  • Explanation of the calculations and drivers behind LMP
  • Details on our assumptions and modelling methodology
  • Deep-dives on forecasted region-specific trends
Download sample report
Why are developers, investors, and asset managers using the Grid Curtailment Forecast?

Key use cases

Investment Risk Assessment

Quantify curtailment risk at the asset level for potential investments, with nodal-level analysis that reveals how specific grid constraints impact projected returns and revenue stability through 2030.

First-mover advantage

Identify promising regions with lower curtailment risk for future development, enabling early-mover advantage in areas with grid capacity.

Portfolio optimisation

Compare curtailment exposure across multiple assets or regions to diversify grid risk within your renewable portfolio.

Due diligence enhancement

Strengthen transaction due diligence with asset-specific technical curtailment data that can be integrated directly into financial models

Submit interest

Our expertise in flexible energy is widely trusted among industry leaders

for investment & business case analysis

for debt financing

for ongoing fund valuations

Looking for more insights in Iberia?